Absolute quantification of human recombinant interferon in rat plasma using Target MS2 method
Gu Peiming
Thermo Fisher Scientific (China) Co., Ltd.
1 Introduction
With the continuous development of proteomics, proteomics has been extensively studied in various fields of biological research. At present, proteomics research has gradually shifted from traditional large-scale identification to targeted proteomics. The identification extends to the relative and absolute quantification of proteins. The relative and absolute quantification of proteins in complex samples can help to discover the biomarkers of diseases, which is of great significance for the study of the occurrence and development of various diseases.
Mass spectrometry-based proteomics quantification methods include SILAC, TMT, iTRAQ, and MRM using triple quadrupole. This article mainly introduces Thermo Scientific's new generation of desktop high-resolution mass spectrometer Q-Exactive in the target protein quantification. application. The results show that Q-Exactive can achieve more than 98% protein amino acid sequence matching in the case of ng-level loading, and the target ms2 method can be used to quantitatively quantify the target protein in complex samples. With amol, the dynamic range is up to 6 orders of magnitude and the linear correlation coefficient is above 0.99.

2. Experimental part
2.1 Sample Information
Human recombinant interferon α-2b standard (concentration: 1 mg/ml), plasma samples of treated rats and human rat plasma samples after injection of recombinant interferon α-2b.
2.2 Experimental procedure
1. Using the Full MS/ddMS2 method to identify the peptides enzymatically digested by human recombinant interferon α-2b standard, and screen its unique peptide;
2. Diluted the human recombinant interferon α-2b standard digestion peptide into different concentrations of standard concentrations of 104 ng/ml, 103 ng/ml, 102 ng/ml, 101 ng/ml, 100 ng/ml, 10- 2 ng/ml, and incorporated into the enzymatic peptide of the blank rat plasma sample, respectively, 18 ul, respectively, using the Target MS2 method to draw a standard curve according to the peak area of ​​the unique ion of the unique peptide;
3. The plasma enzymatic peptides of the treatment group were loaded with 18 ul, and the concentration of human recombinant interferon α-2b in rat plasma was calculated according to the area of ​​the fragment ion peak of its unique peptide.
2.3 Instrument conditions
2.3.1 High performance liquid chromatography conditions
High Performance Liquid Chromatograph: Thermo Scientific Easy-nLC 1000
Column: C18, 3μm, 100Å, 75μm × 15 cm
Load capacity: 18 ul
Mobile phase: A: 0.1% Formic acid in water; B: 0.1% Formic acid
In Acetonitrile
Chromatographic gradient:
Time[mm:ss] | Duration[mm:ss] | Flow[nl/min] | Mixture[%B] |
00:00 | 00:00 | 350 | 3 |
05:00 | 05:00 | 350 | 8 |
42:00 | 37:00 | 350 | 20 |
47:00 | 05:00 | 350 | 30 |
50:00 | 03:00 | 350 | 90 |
60:00 | 10:00 | 350 | 90 |
2.3.2 Mass spectrometry conditions
Standard:
Mass Spectrometer: Thermo Scientific Q Exactive
Spray voltage: 2.6 kV
Capillary temperature: 250 °C
S-lens: 50%
Collision energy: 27% HCD
Resolution setting: Level 70,000@m/z 200, Level 17,500@m/z 200
Parent ion scanning range: m/z 200-1800; product ion scanning range: startfrom m/z 100
Data-dependent MS/MS: Top 20
Standard curve and official sample:
Mass Spectrometer: Thermo Scientific Q Exactive
Spray voltage: 2.6 kV
Capillary temperature: 250 °C
S-lens: 50%
Collision energy: 27% HCD
Resolution setting: 35,000@m/z 200
Isolation Window: 4 M/Z
Inclusion List:M/Z 451.75
3 results analysis
3.1 Screening for quantitative peptides
First, Q-Exactive was used to perform full MS/ddMS2 scanning on the enzymatic peptide of human recombinant interferon α-2b standard. The sample loading was 500 ng (excluding enzymatic loss), and the unique recombinant interferon α-2b was screened for the unique peptide. The peptide must be a peptide specific to human recombinant interferon alpha-2b before it can be used to characterize the amount of human recombinant interferon alpha-2b.
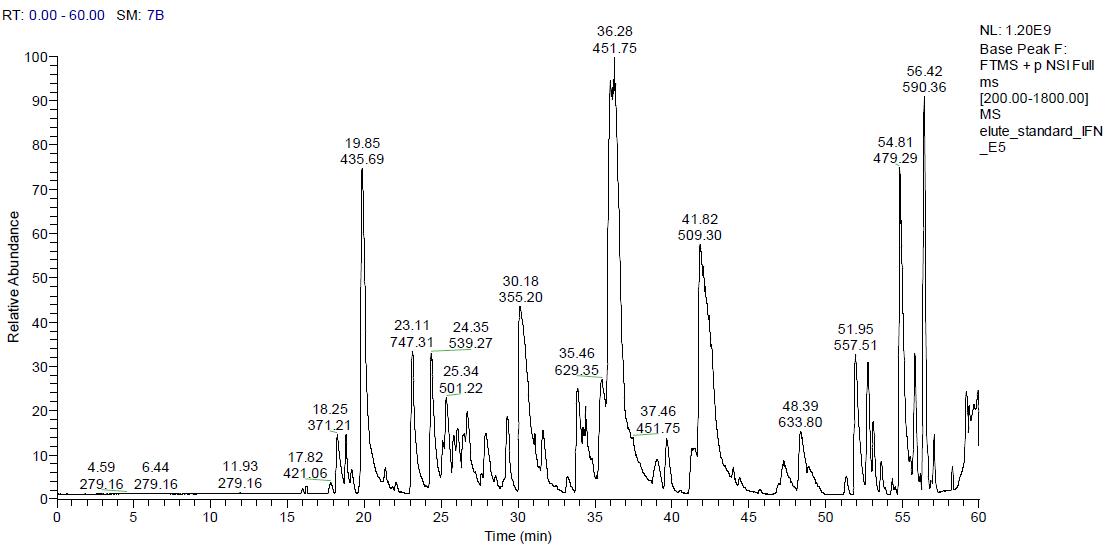
The figure below shows the original image of human recombinant interferon α-2b chromatographic mass spectrum. It can be seen that the whole chromatographic peak is relatively uniform and the intensity is relatively high.
The original documents obtained above were searched using Byonic software to observe the sequence matching degree of the protein, and the database used the amino acid sequence of human recombinant interferon α-2b downloaded by DrugBank.

As can be seen from the above table, the amino acid sequence matching degree of human recombinant interferon α-2b reached 98.18%, indicating the ultra-high sensitivity of Q-Exactive, and high amino acid sequence matching of proteins in the case of less than 500 ng of loading. The degree of analysis is very important for the reliability of subsequent data analysis.
The figure below shows the specific amino acid sequence matches of human recombinant interferon alpha-2b. The green-labeled amino acid sequence in the figure is the identified amino acid, the red-labeled is the identified modified amino acid, and the black-labeled is the amino acid not identified in the experiment.
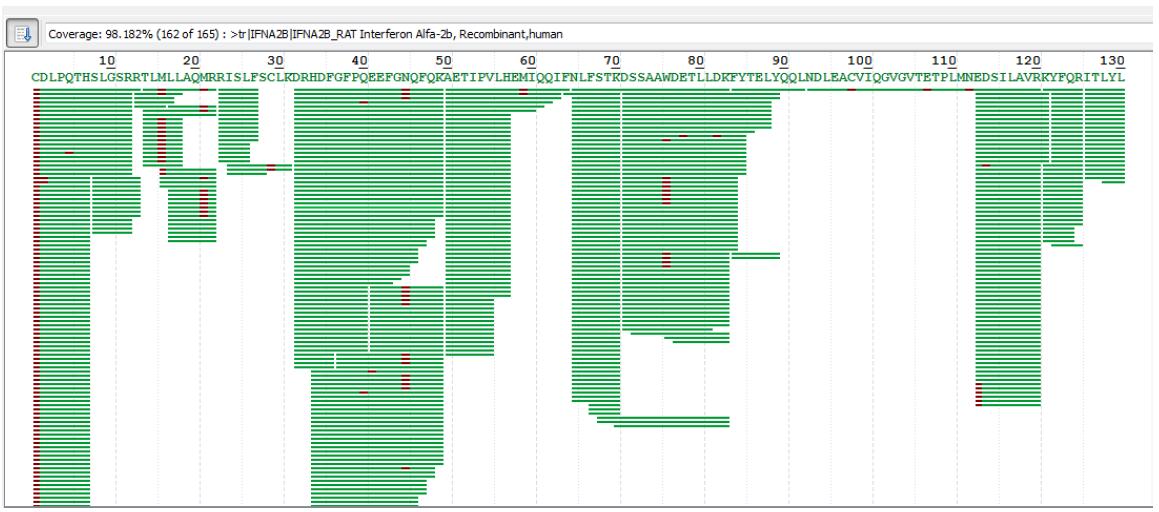

As can be seen from the above figure, only the last three amino acids of the 165 amino acids were not identified. The analysis found that the amino acid at position 162 was R, and thus was cleaved in the enzymatic hydrolysis of Trypsin, resulting in the last three peptides. Amino acid, this peptide is too short to be suitable for mass spectrometry.
From the original chromatogram of the above chromatogram, it can be seen that the chromatographic peak with the elution time of 36.28min and m/z of 451.75 has the highest intensity.
The results showed that the chromatographic peak was the unique recombinant interferon α-2b's unique peptide “EDSILAVRâ€. The figure below shows the parent ion chromatographic mass spectrometry peak and its secondary spectrum of EDSILAR (m/z 451.75).
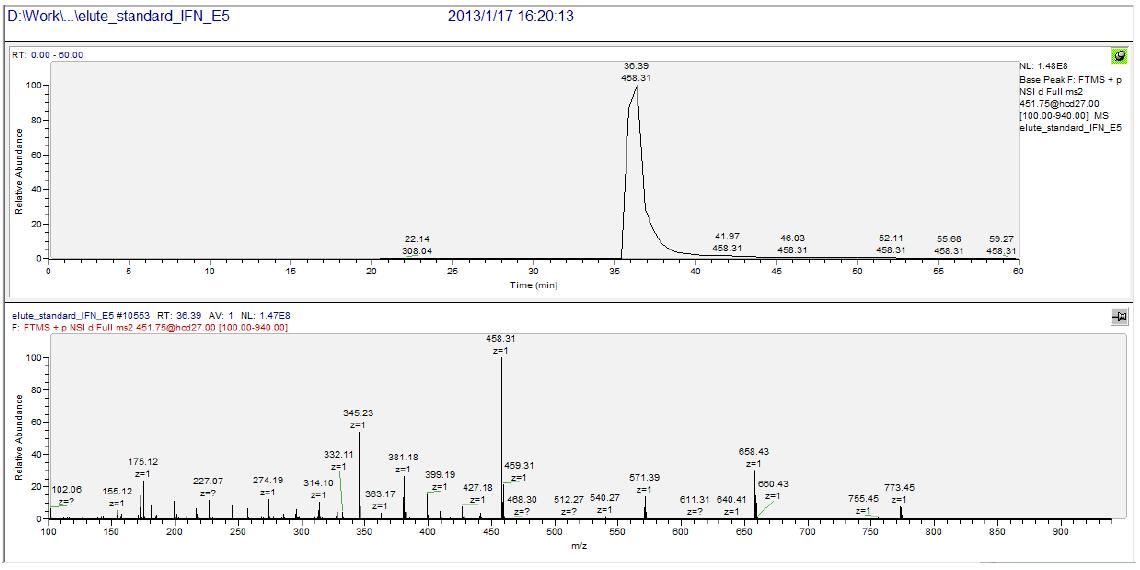
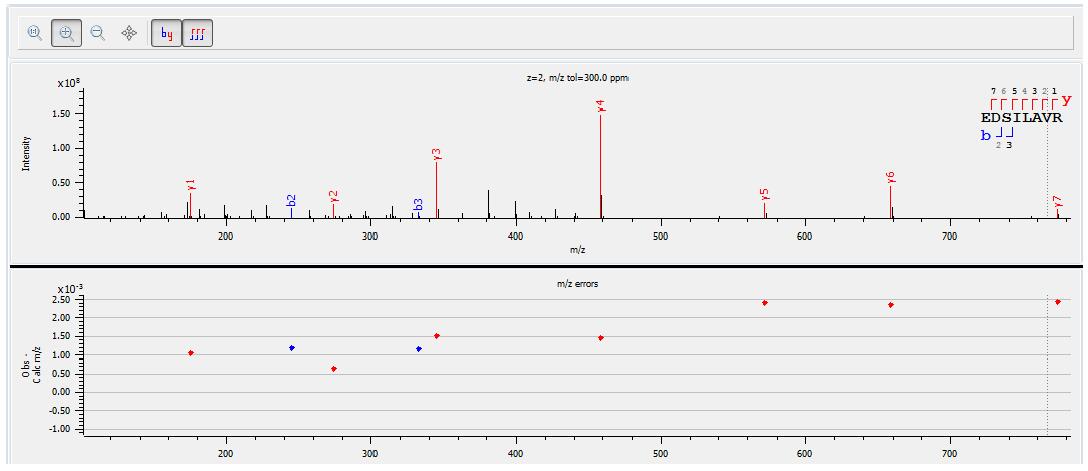
The figure below shows the analysis of the above-mentioned peptide EDSILAVR secondary spectrum. It can be seen that all y series ions are identified, and the measured m/z and theoretical m/z deviation of the daughter ions are at 10-3 level. The quality of the graph is very high and the results are very reliable. In addition, it can be seen from the secondary spectrum that the secondary fragment ion y4, m/z 458.31, has the highest intensity, so the parent ion-ion pair of 451.75-458.31 is selected in the subsequent data analysis to characterize EDSILAVR. The content, in turn, characterizes the amount of human recombinant interferon alpha-2b (this method is selected reaction monitoring technology: SRM Selected Reaction Monitoring).
3.2 Standard curve drawing
The standard peptides for human recombinant interferon alpha-2b digestion were diluted to the following concentrations: 104 ng/ml, 103 ng/ml, 102 ng/ml, 101 ng/ml, 100 ng/ml, 10-2 ng/ml, each aspirating 8 ul. Mix with 10ul blank plasma-enzymatic peptide samples, load 18ul, mass spectrometry, use TargetMS2, the inclusion list is m/z 451.75, and the isolation window is 4 m/z. The product ion 458.31 was extracted and the results are shown in the figure below.
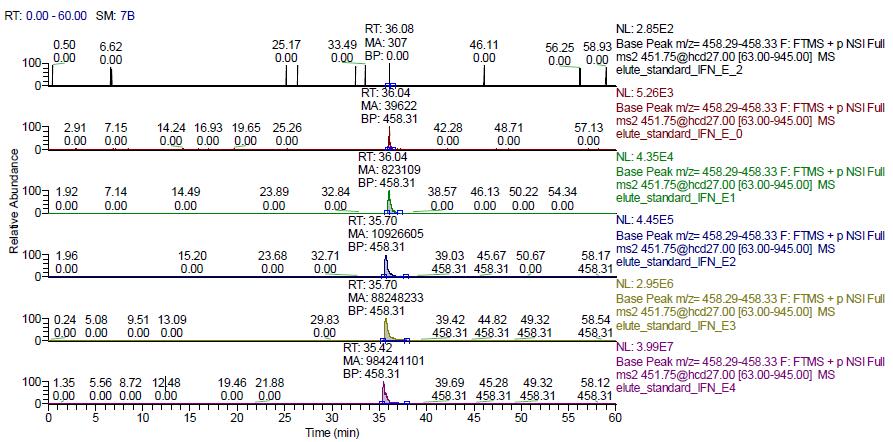
As can be seen from the above figure, all the 6 concentrations of the standard have a chromatographic elution peak around 36min, which is consistent with the elution time of the above standard. The peak is 451.75-458.31 parent ion-ion ion pair The chromatographic peak, the elution peak of EDSILAR, is integrated into the peak area of ​​each chromatogram (the MA value shown on the chromatogram in the above figure). The results are shown in the table below.

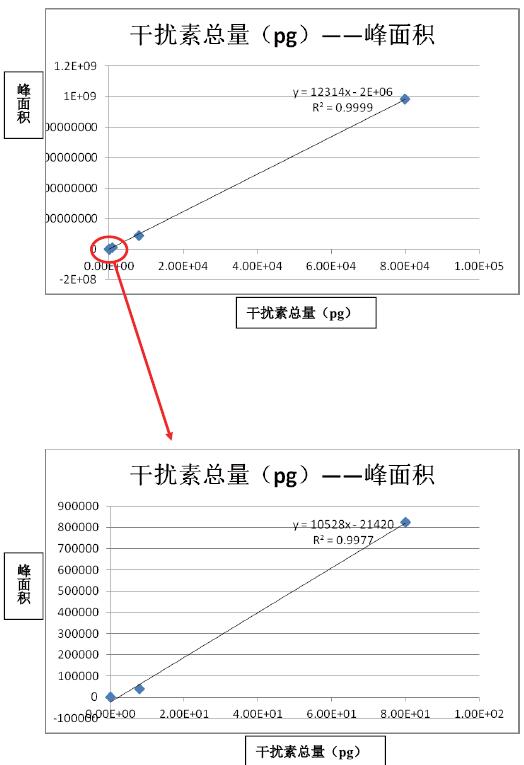
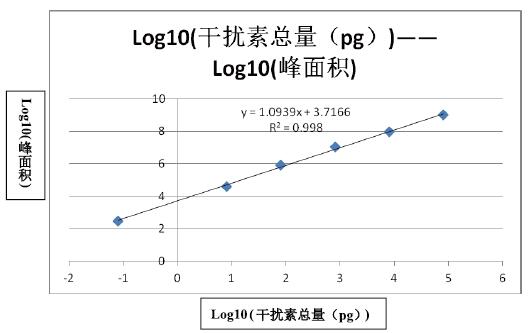
It can be seen from the above results that the linear correlation coefficient between concentration and peak area is above 0.99 in the concentration range of 6 orders of magnitude, indicating that the detection dynamic range of Q-Exactive is large enough to be applied to protein drug metabolism. Learning research.
3.3 Determination of human recombinant interferon α-2b concentration in rat plasma samples
Rat plasma samples were loaded with 18 ul and detected by mass spectrometry. The original results are shown in the figure below. It can be seen that there is an obvious chromatographic elution peak at 35.33 min. The elution time is consistent with the elution time of the above standard, which is plasma. The elution peak of the peptide EDSILAVR of the human recombinant interferon α-2b in the sample was integrated for the area of ​​the m/z 458.31 daughter ion.
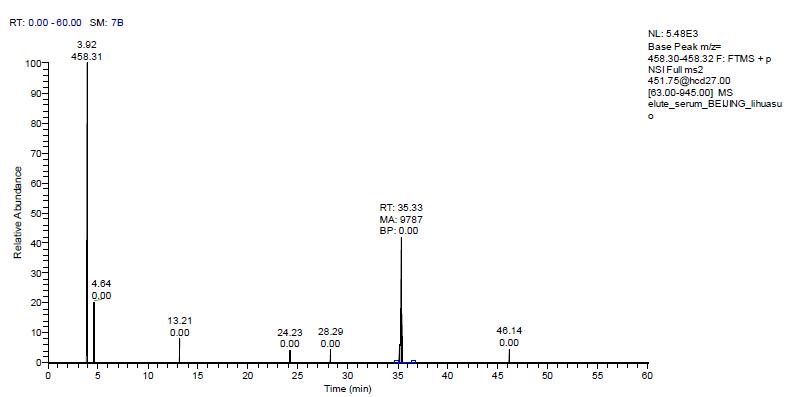
The peak area was 9787, which was substituted into the above standard curve to calculate that the concentration of human recombinant interferon α-2b in the original plasma was 26.9185 ng/ml.
4 Summary
In summary, Q-Exactive has an ultra-high sensitivity, and the amino acid sequence matching of human recombinant interferon α-2b reaches 98.2% in less than 500 ng load; Q-Exactive has a sufficiently high dynamic In the range of standards for the detection of human recombinant interferon alpha-2b, the dynamic range reached 6 orders of magnitude and the linear correlation coefficient reached above 0.99. In short, the ultra-high performance of Q-Exactive can be well applied to the study of macromolecular drug metabolism.
We're professional Gynecology Hysteroscopy manufacturers and suppliers in China, specialized in providing high quality medical instruments with reasonable price. We warmly welcome you to buy or wholesale bulk Gynecology Hysteroscopy for sale here and get quotation from our factory.
Gynecology Hysteroscopy,Hysteroscopy Instrument Set,Hysteroscopy Set,Outer Sheath
Tonglu WANHE Medical Instrument Co., Ltd , https://www.tlvanhurhealth.com